Transactional History is a list of users’ tasks filtered by date and task type.
The following are the steps to generate the report for Transactional History:
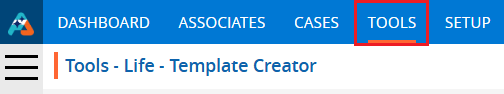
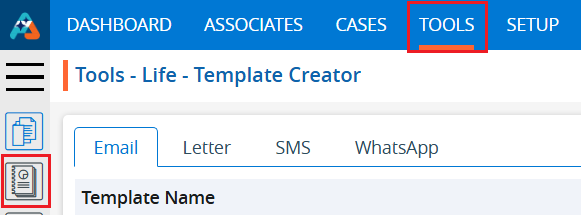
1. Navigate to the ‘TOOLS’ tab..
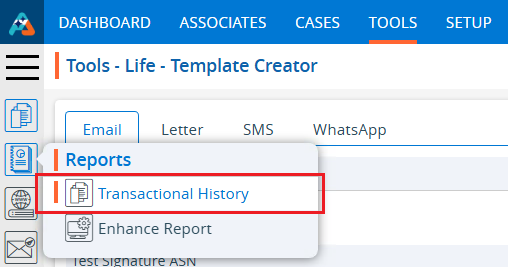
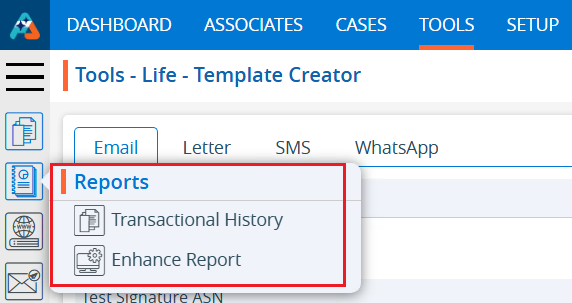
2. Click on ‘Reports’ in the left-side menu, then select the ‘Transactional History’ option from the list of reports.
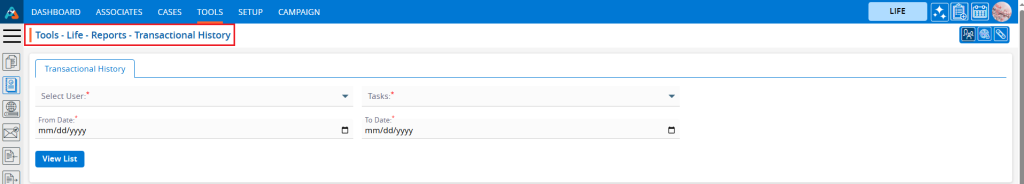
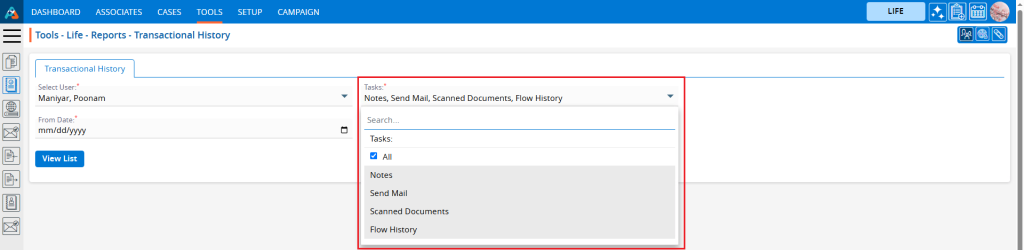
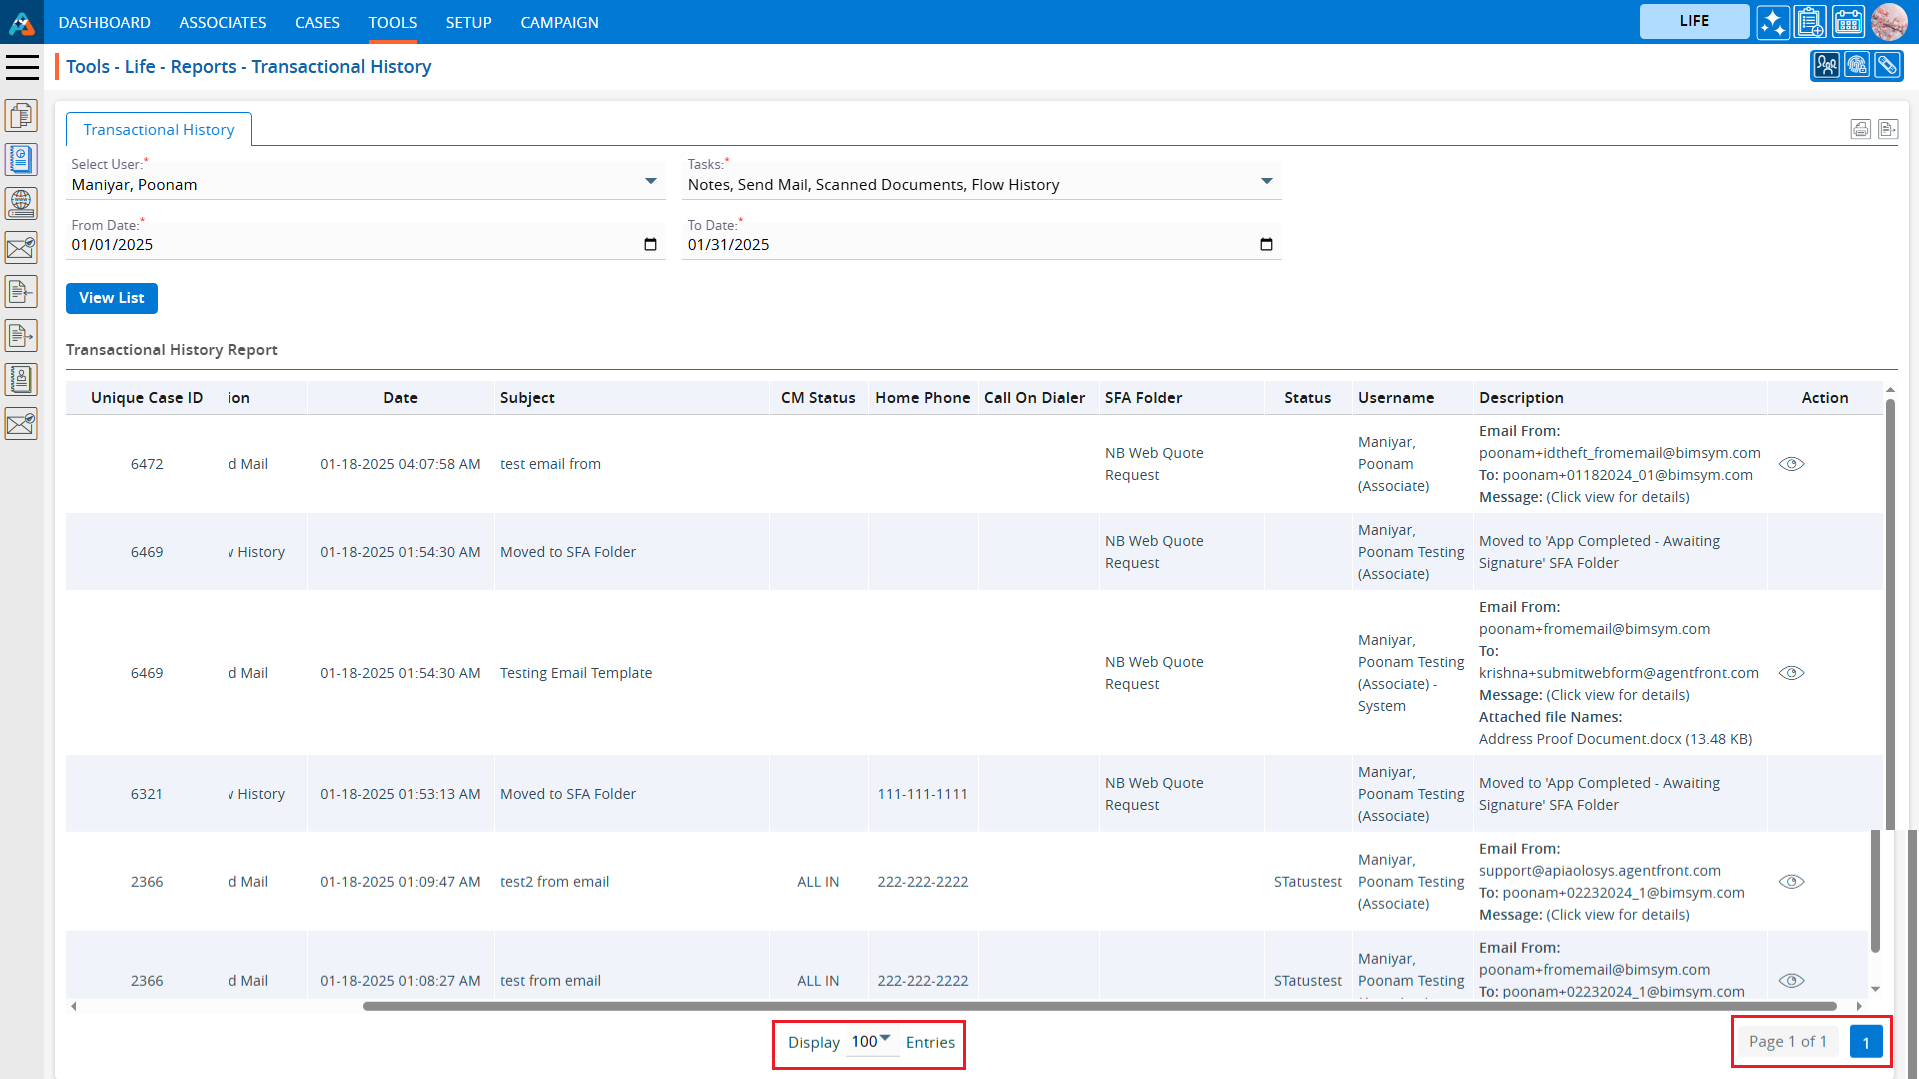
3. By clicking on Transactional History a new page titled ‘Tools – Life – Reports – Transactional History’ will open. This page will provide dropdown menus to select users and tasks by date.
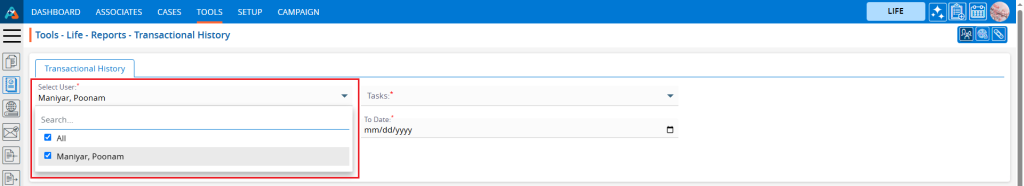
4. Select a user from the dropdown menu to generate and view their ‘Transactional History’ details.
5. The ‘Tasks’ dropdown includes options such as Notes, Send Mail, Scanned Documents, and Flow History. Select the desired option from the dropdown menu. Users can choose either a single option to view or select ‘All’ to view the history for all categories together. For example, the ‘All’ option is selected from the dropdown menu.
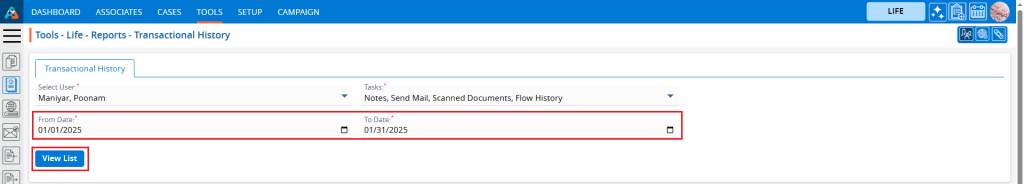
6. Select the desired date range for the data to be listed, and then click on ‘View List’ to proceed.
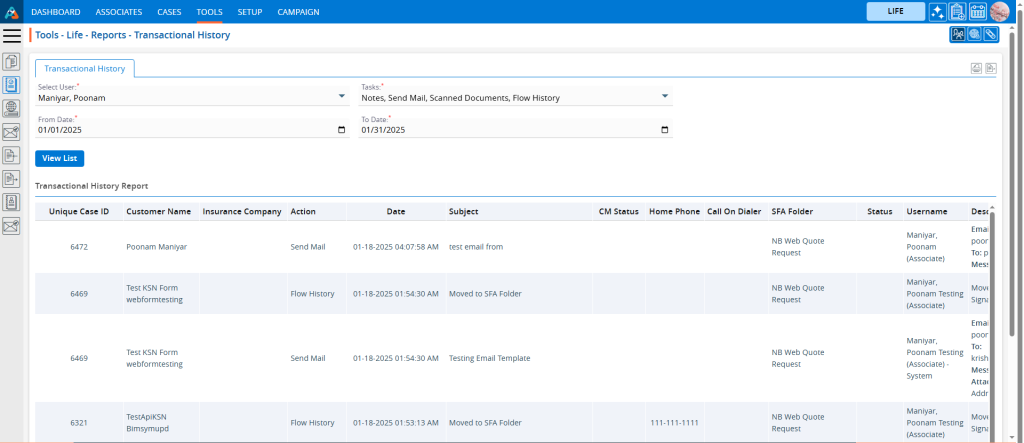
7. It will display the transactional history details for the selected task(s) within the specified date range for the chosen user.
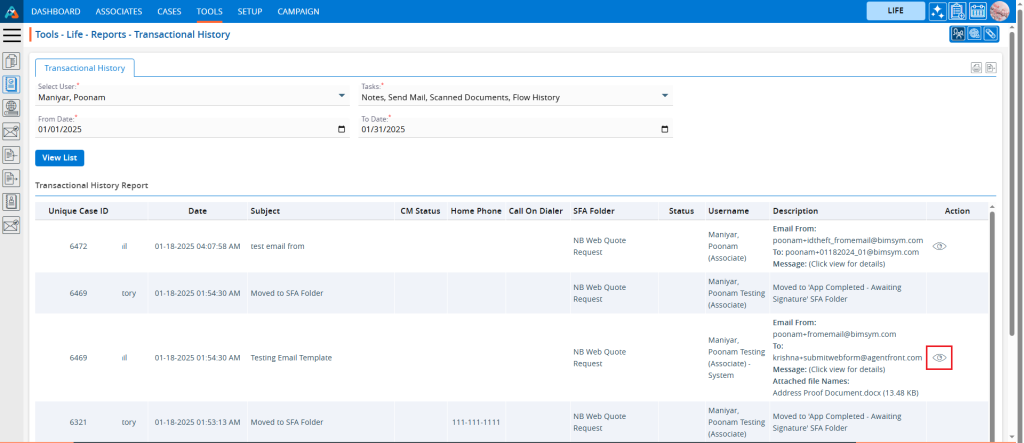
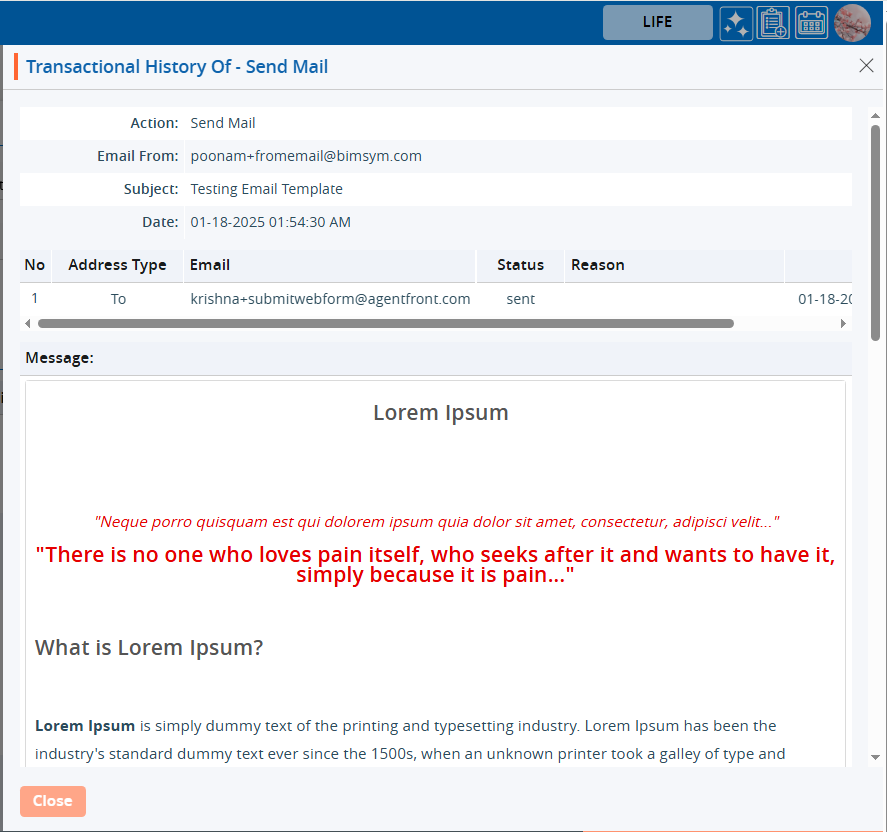
8. Click on the ‘View’ option next to the task for which the user wants to see details.
9. A new pop-up window will open to display the details of that selected transactional history. Click the ‘Close’ button to exit.
10. Choose an option from the display settings at the bottom to specify the number of records to show per page, based on the total number of available records. After selecting the Display option, the system will present the records and pagination based on the chosen setting. For example, if the user selects 50 cases per page, the system will display 50 web resources per page, with the data distributed accordingly.
The Enhance Report allows users to create and manage reports within the system, enabling easy review and updates at any time.
The following are the steps to manage the Enhance Report: 1. Navigate to the ‘TOOLS’ tab and select Reports from the left-side panel.
2. A pop-up window will open. Click on Enhance Report.
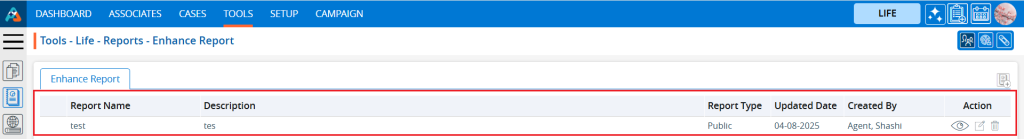
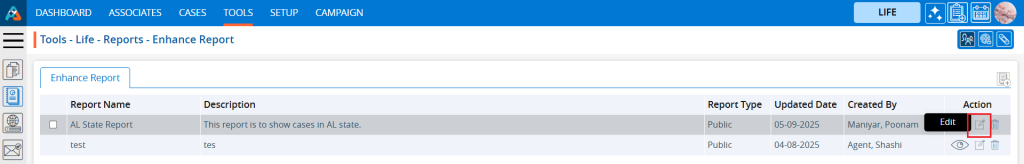
3. The Enhance Report page will load, displaying a list of existing reports, including columns for Report Name, Description, Report Type, Updated Date, Created By, and Action.
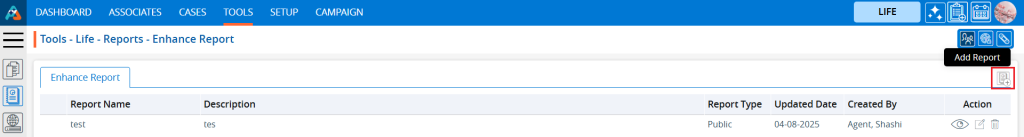
4. To create a new Enhance Report, click the ‘Add Report’ icon.
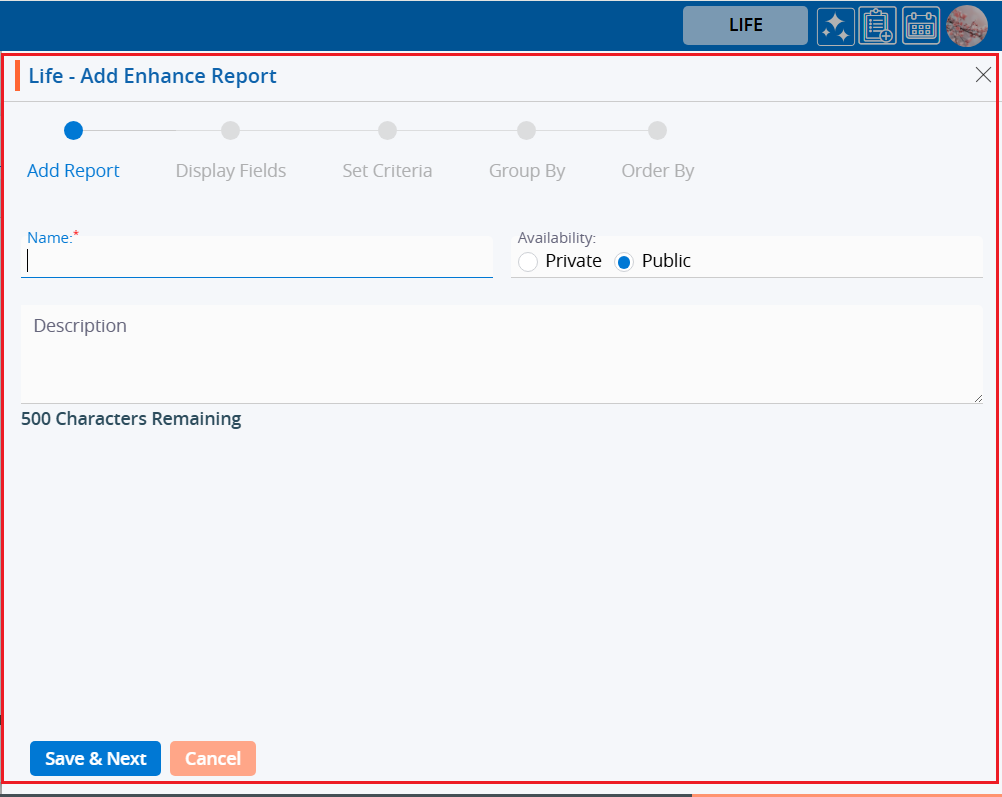
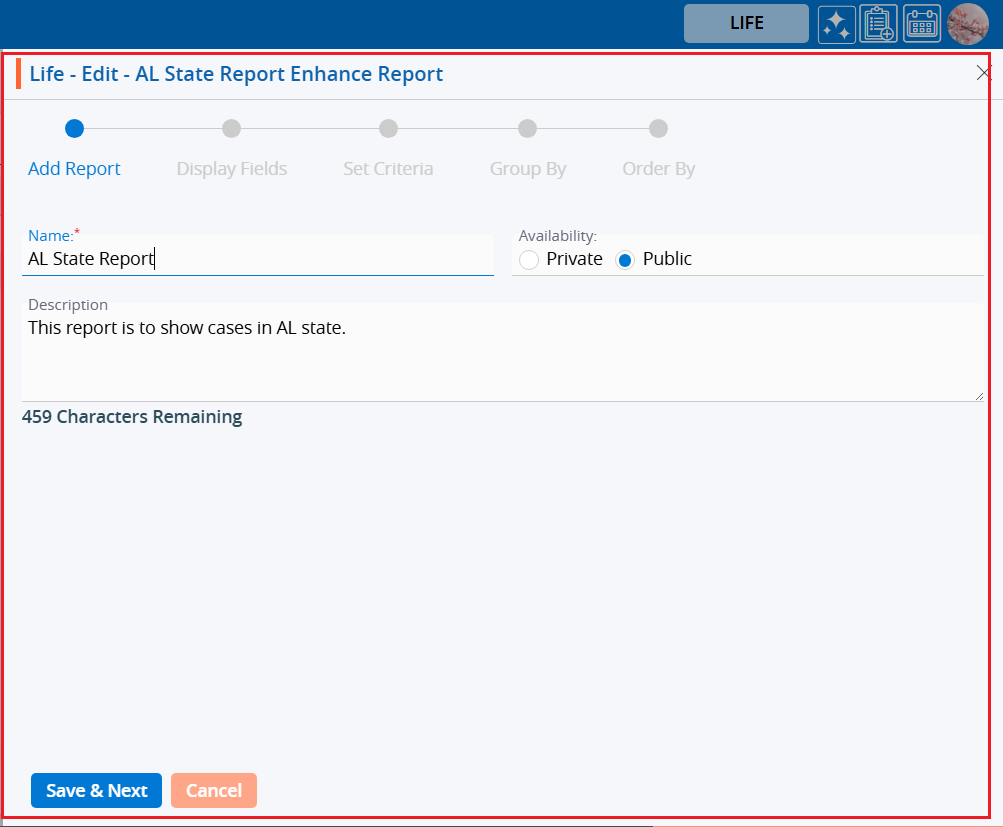
5. A new pop-up window will appear with fields for the Add Report page, including Name, Availability, and Description. The Save & Next and Cancel buttons are located at the bottom. The remaining page will be greyed out. 6. Fields marked with an asterisk (*) are mandatory, such as Name. 7. The Description field allows for up to 500 characters.
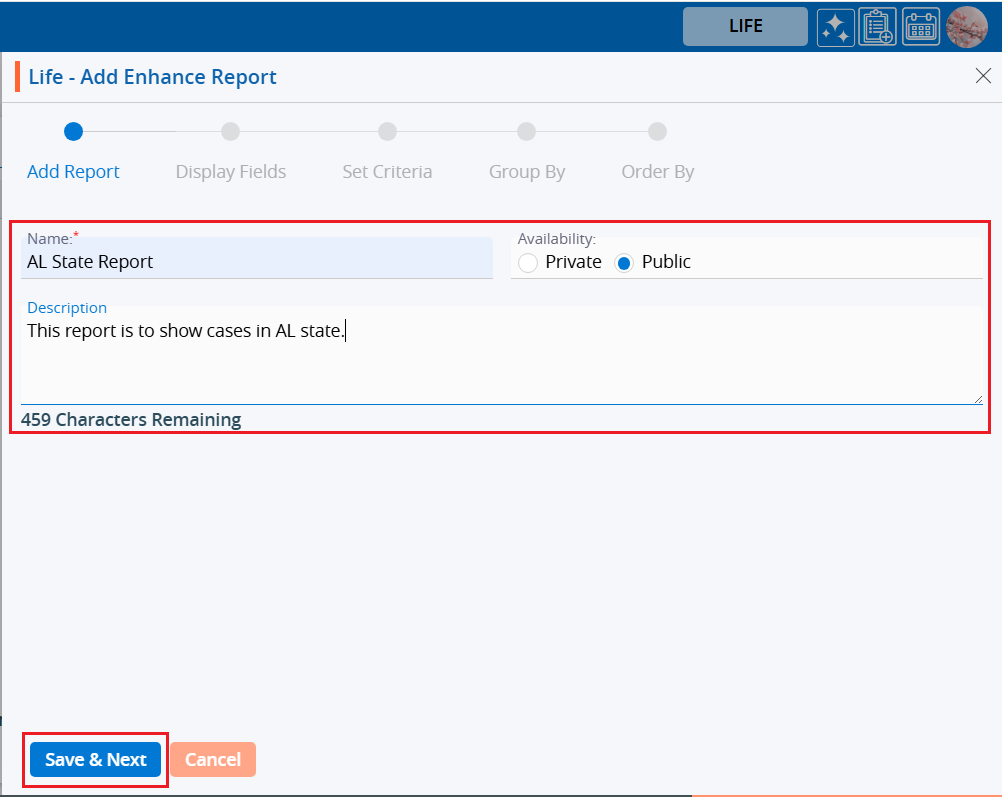
8. Fill in the required fields and click ‘Save & Next’ to save the report and proceed to the next step.
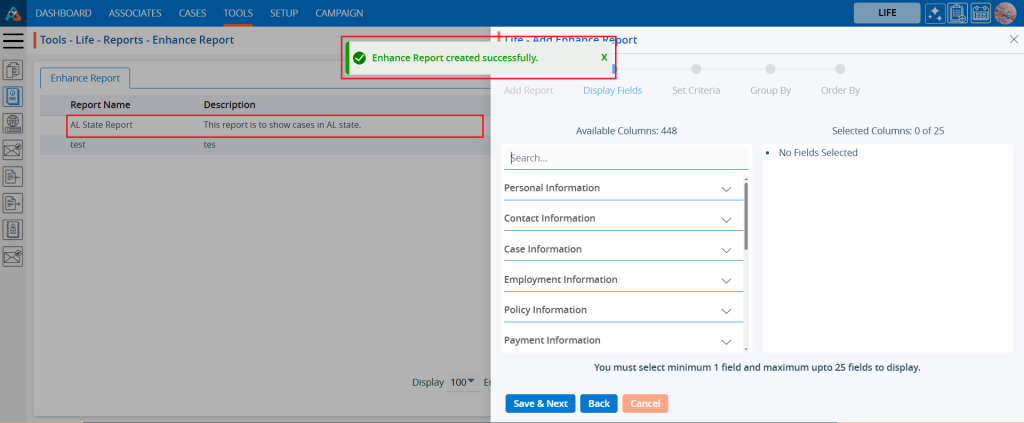
9. A confirmation message will appear indicating the report has been added. The newly created report will be displayed in the list.
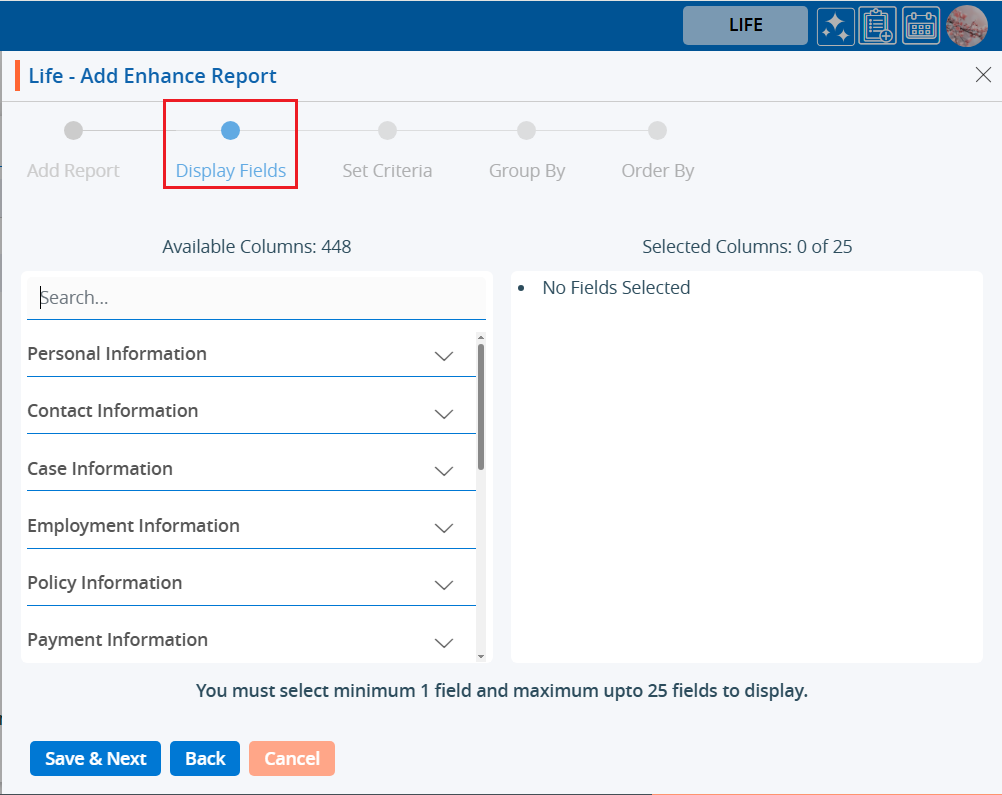
10. The system will then redirect you to the Display Fields page.
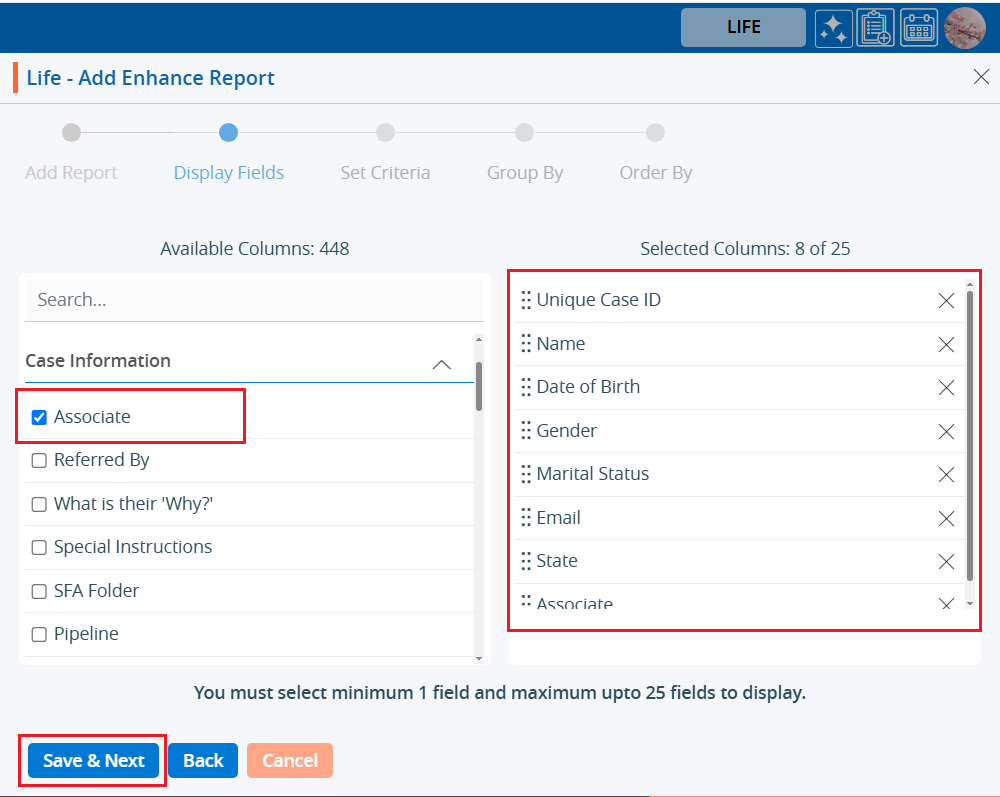
11. From the Available Columns on the left, select the fields you want to include in the report. The selected fields will appear in the Selected Columns List on the right. Click Save & Next to continue or click Back to make changes. 12. A minimum of 1 field and a maximum of 25 fields can be added.
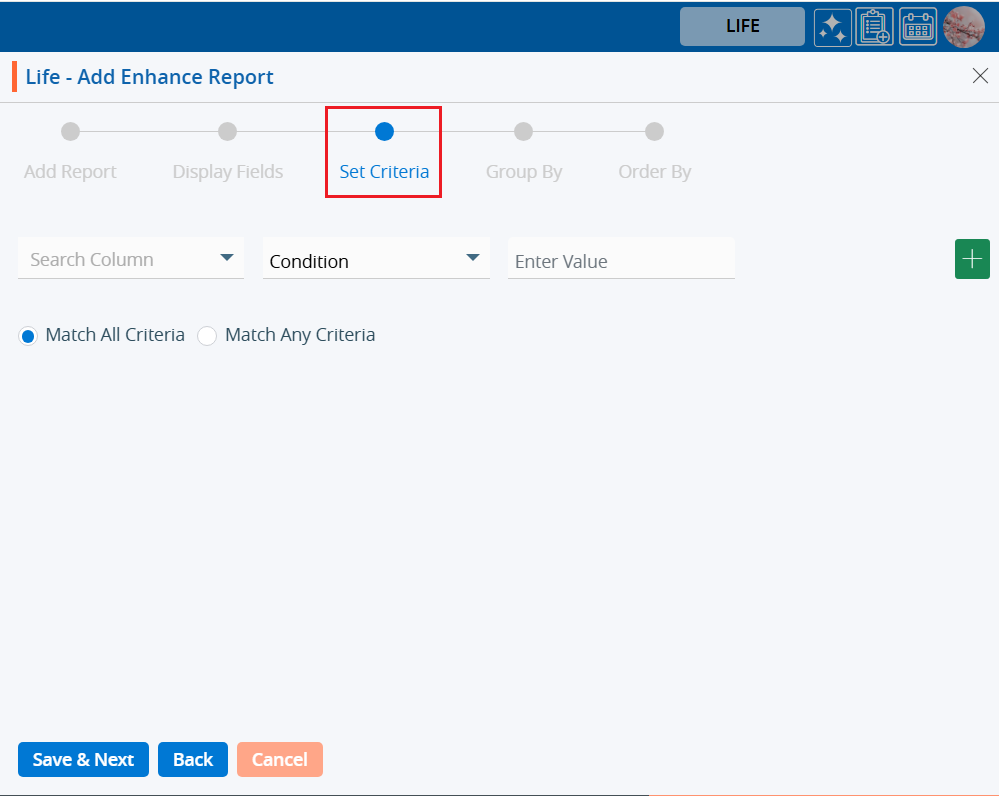
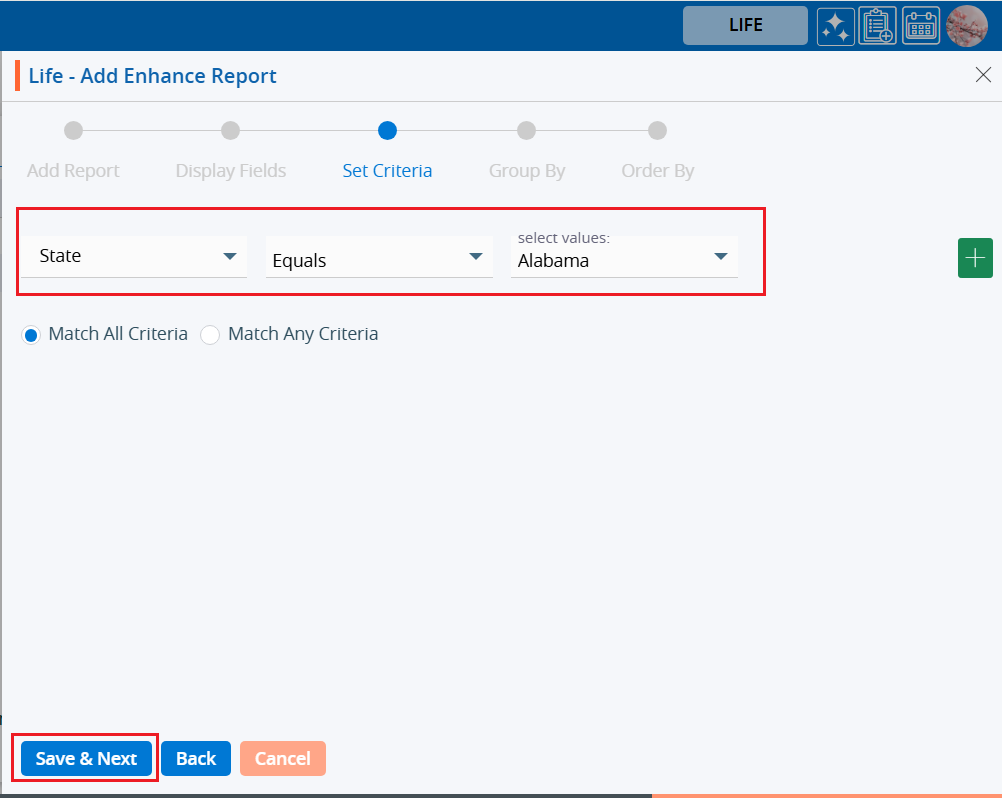
13. The next page, Set Criteria, will open.
14. Add the criteria for the report and click Save & Next to proceed, or click Back to modify any previous selections.
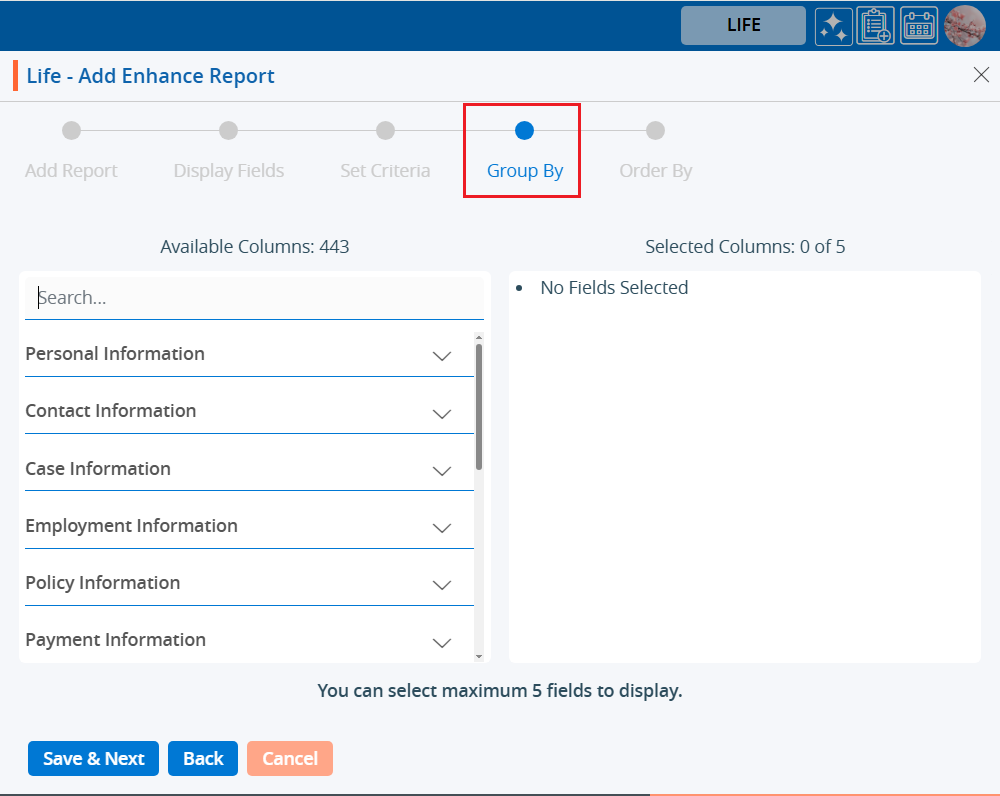
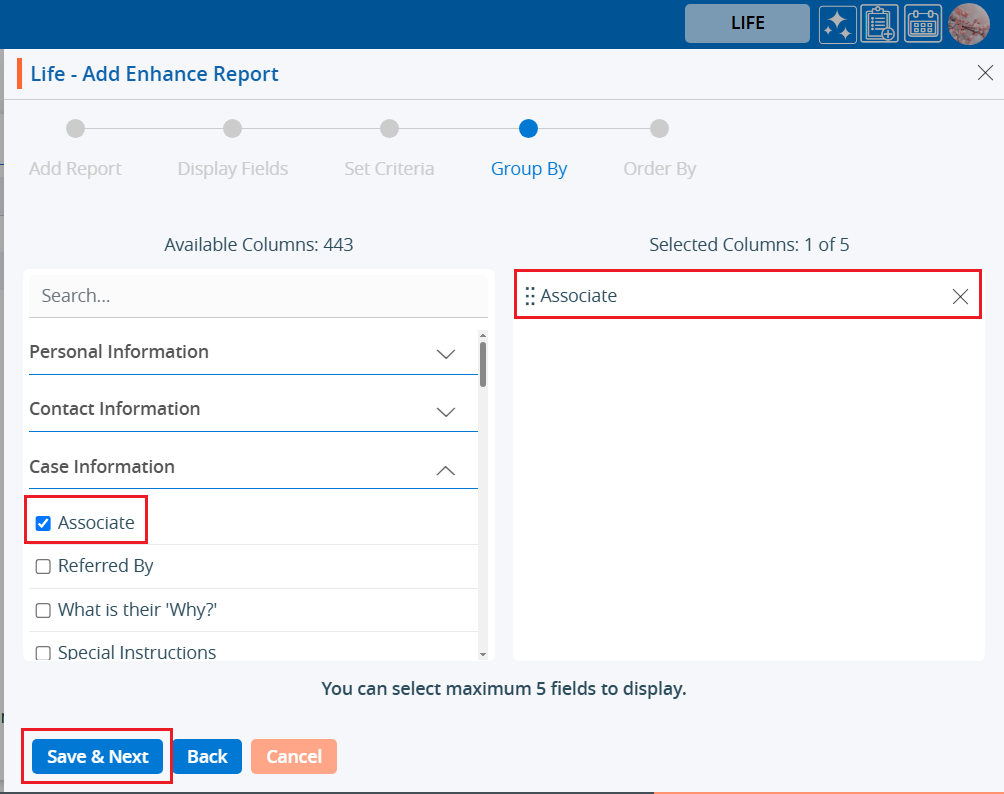
15. The Group By page will open next.
16. Select a field by which you want to group the data. Click Save & Next to continue or Back to update any previous steps.
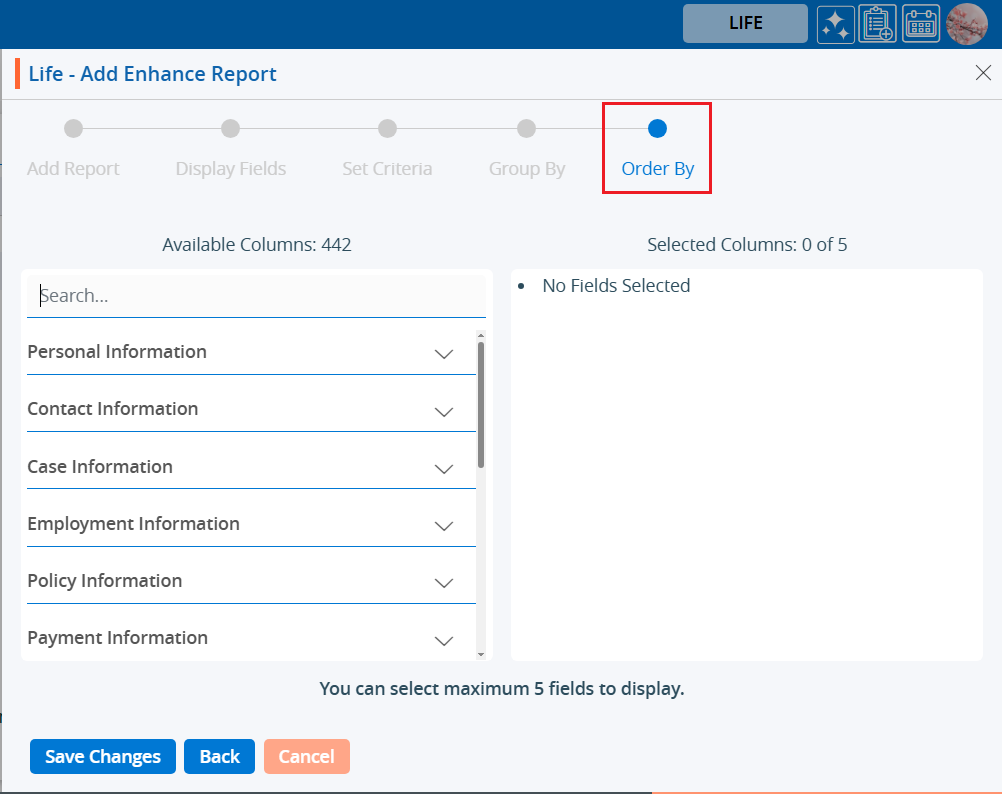
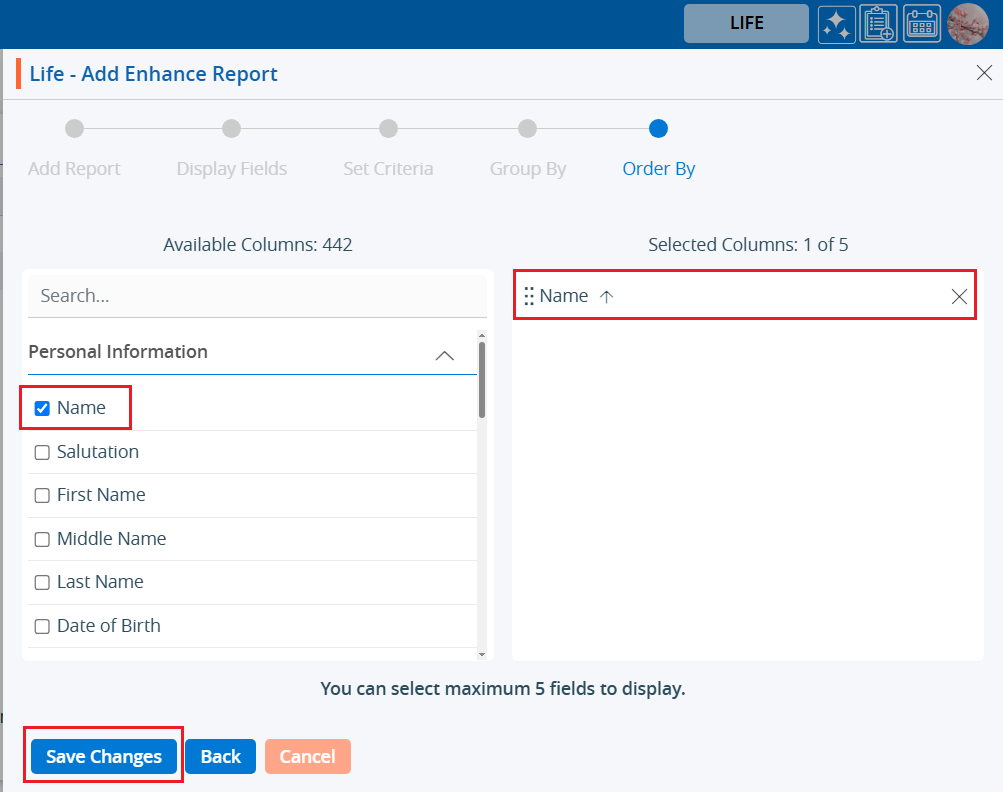
17. The Order By page will open.
18. Choose a field to sort the data by. Click Save & Next to move on or Back to make changes.
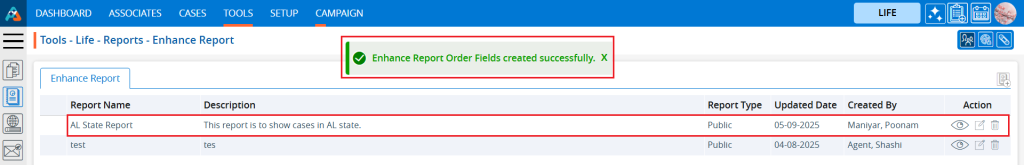
19. A confirmation message will appear confirming the report has been successfully created, and it will be available in the report list.
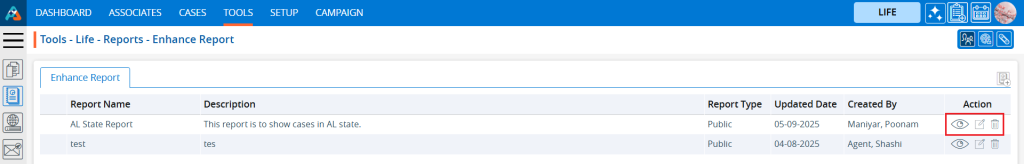
20. Each report in the list will have three option: a. View b. Edit c. Delete
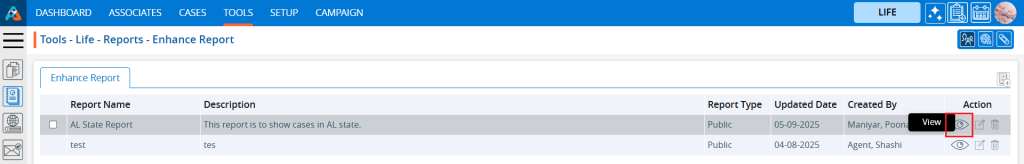
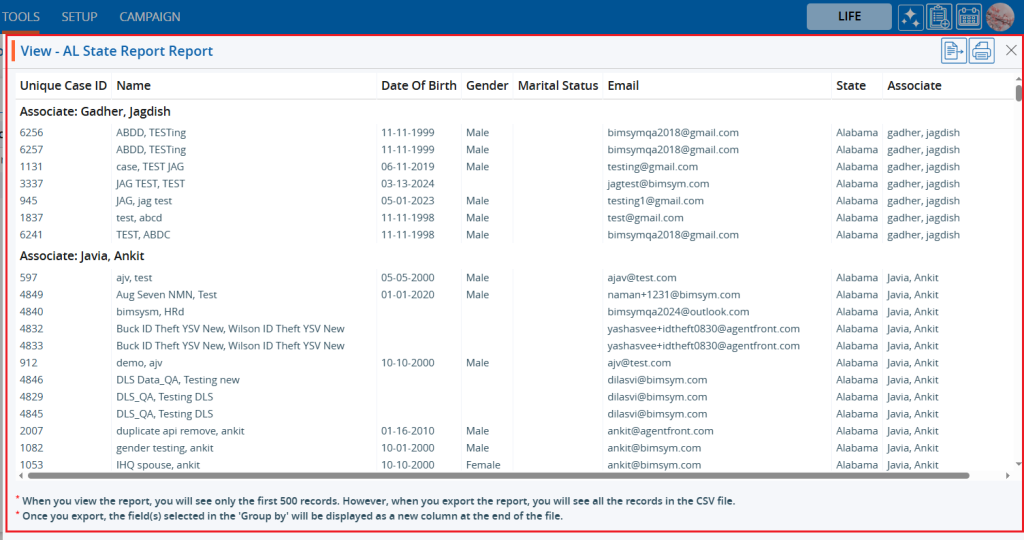
21. To view the report, click on the View icon.
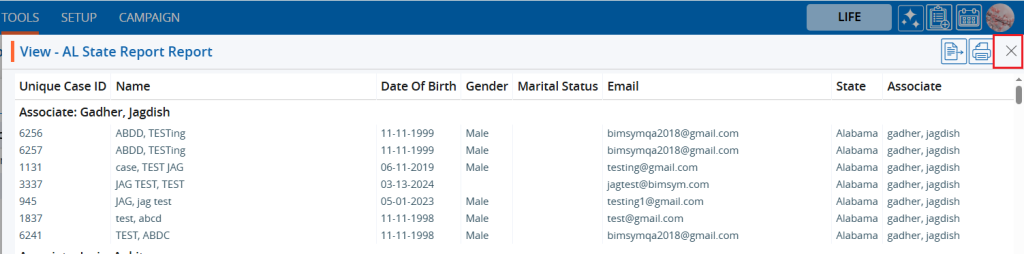
22. When viewing the report, note the following: a. Only the first 500 records will be displayed on the screen, but when you export the report, all records will be included in the CSV file. b. The Group By field(s) will appear as a new column at the end of the exported file.
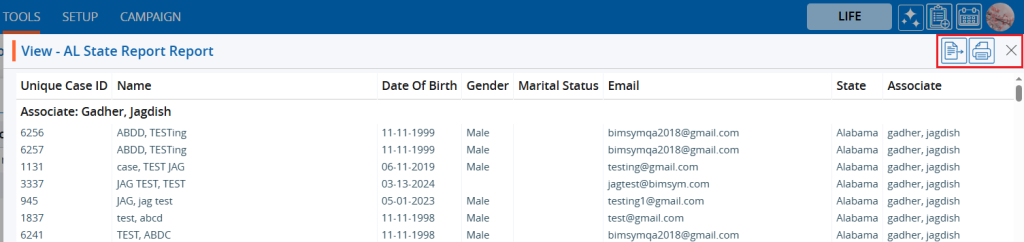
23. While viewing the report, you have the following options: a. Export b. Print c. Close
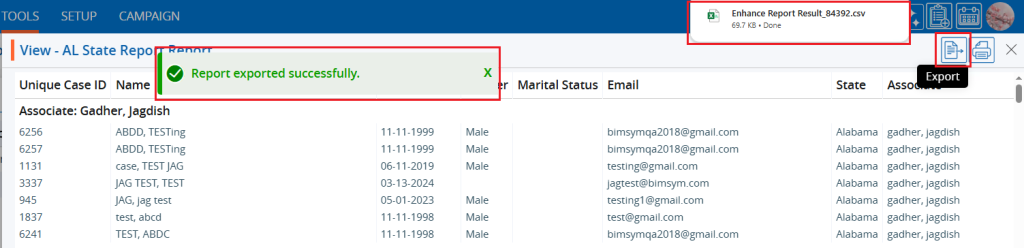
24. Click Export to download the data in CSV format. A message will confirm the report has been successfully exported, and the CSV file will be saved to a temporary location.
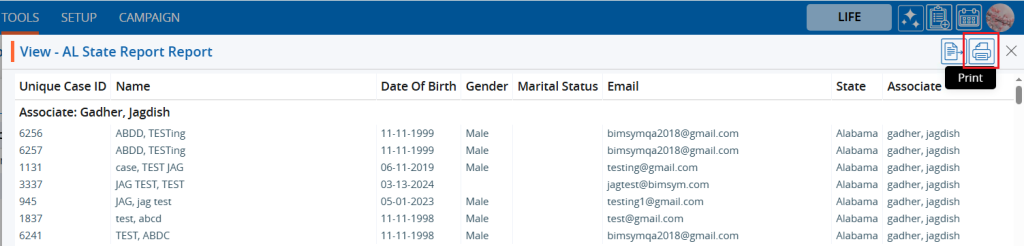
25. Click Print to print the report.
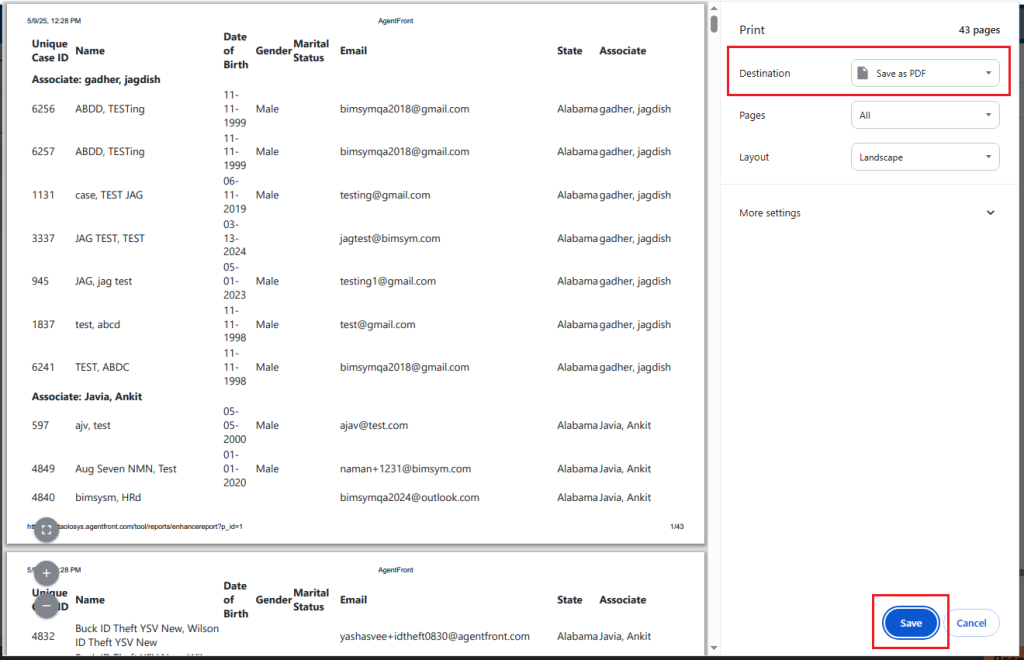
26. A pop-up window will open showing the current page data with various print options. Select Save as PDF from the Destination field and click Save to save the file to a location of your choice.
27. To close the report, click the Close icon in the top-right corner.
28. To edit the report, click the Edit icon.
29. The report will open in edit mode.
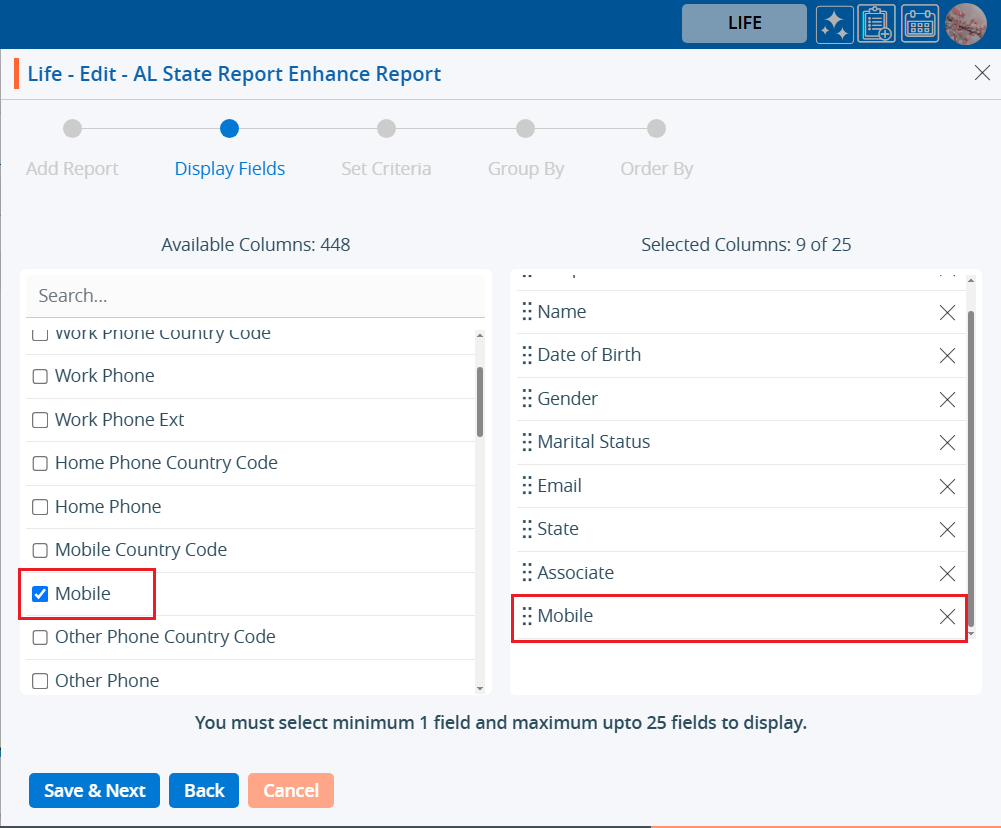
30. The user can make changes to any part of the report. For example, to add a Mobile field, go to the Display Fields page, select the Mobile field, and save the report.
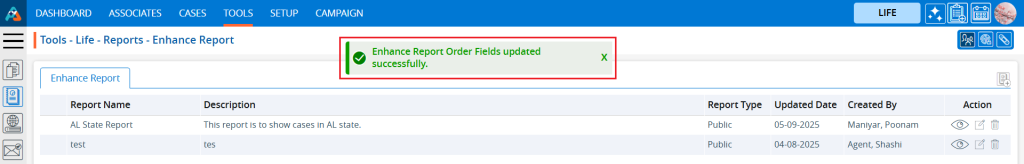
31. Changes are saved, and a confirmation message will appear.
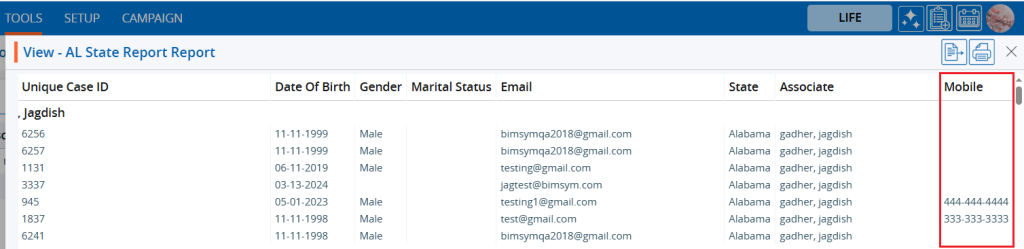
32. To view the changes, open the report by clicking the View icon.
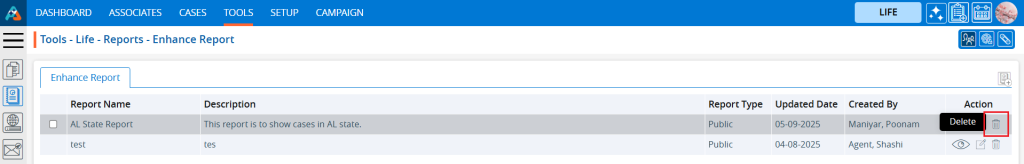
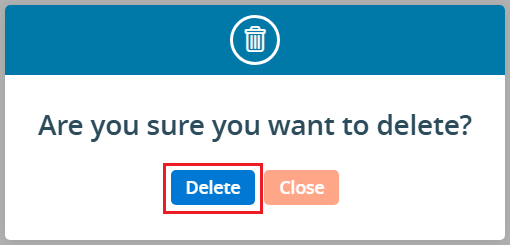
33. If the report is no longer needed, click the Delete icon to remove it.
34. A confirmation pop-up will appear. Click Delete to confirm.
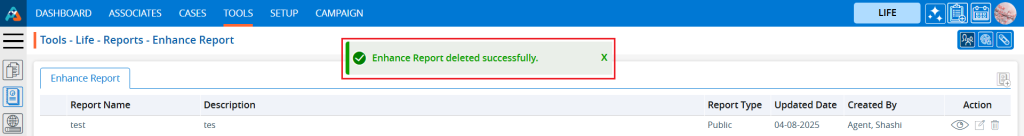
35. A confirmation message will appear, indicating the report has been deleted and is no longer available in the list.
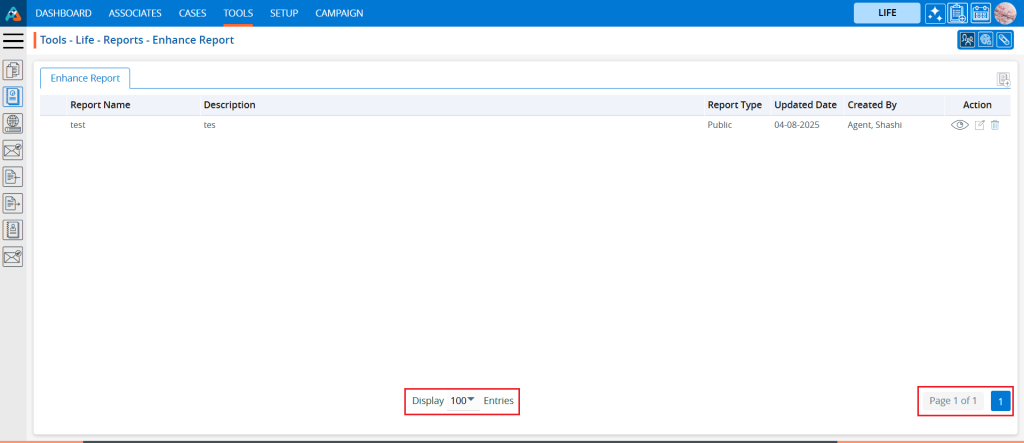
36. The user can adjust how many reports appear per page using the Display dropdown at the bottom, and the pagination will update accordingly, allowing you to navigate easily between pages.